This page may be embedded in an HTML frame. If so, be sure to utilize the vertical scroll bar on the HTML frame as well as the vertical scroll bar in your browser.
Before reading this page, testers new to Y DNA testing at FTDNA should be familiar with Y DNA terminology and navigation and basic interpretation of Y results. Parts III and IV of the DNA Tutorial and Testing Q & A might be helpful.
How extensively Y DNA is analyzed on a given haplogroup page depends entirely on whether project members are ACTIVE participants in their projects and have formally given written permission for their data to be analyzed on these haplogroup pages. For projects with few or no ACTIVE participants, you won't see much on the page.
The more ACTIVE participation there happens to be in that haplogroup for the project, the more data is shared and so the more analytical features there will be on that haplogroup page.
 SNP Calendar/Timeline Back to Top
 Almost every haplogroup page contains an SNP Calendar / Timeline, as this does not require cooperation from project members.
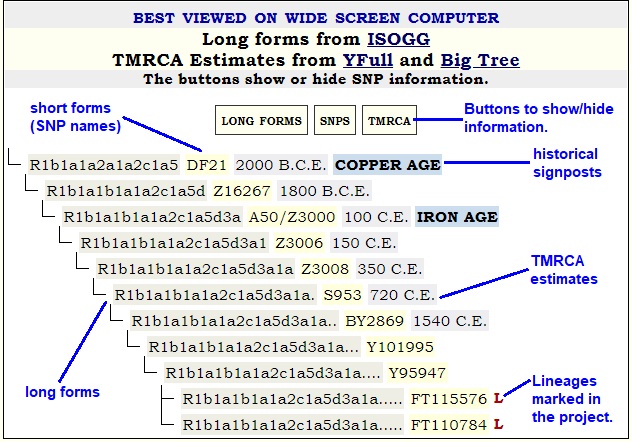
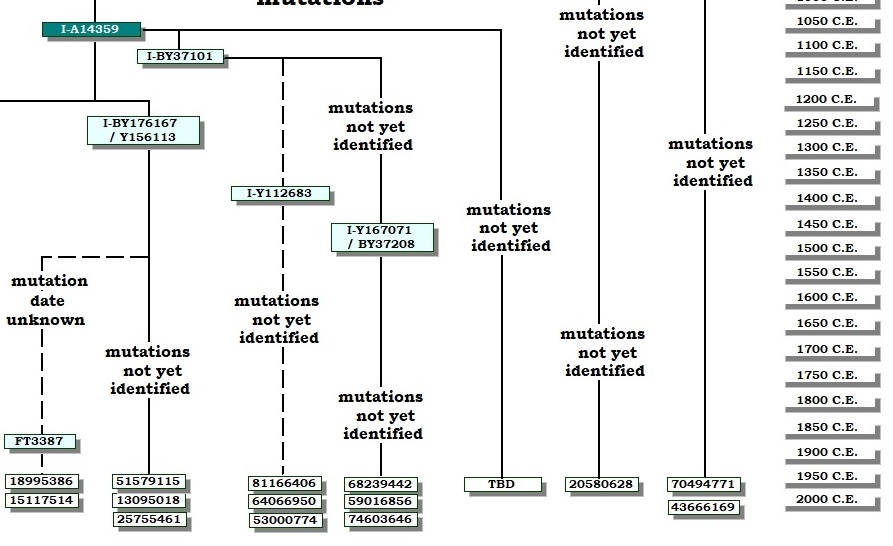
The SNP Calendar merges long form SNP names from ISOGG; SNPs from FTDNA and YFull; and TMRCA estimates from YFull or possibly Big Tree.
TMRCA is different from SNP formation date.
YFull uses Years Before Present (YBP) notation. These pages use absolute years with Before Christian Era (B.C.E.) and Christian Era (C.E.) abbreviations. YFull's YBP is converted to an absolute year as 2000 - YBP. Gradually those TMRCA estimates are being converted to 2020 - YBP.
Time estimates change rapidly so calendars go out of date quickly. SNP data from the three aforementioned sources are not synchronized. You should expect inconsistenies between these sources, and you should expect revisions. Currently, there are many SNPs lacking long form citations. Therefore, the SNP calendar may fill in missing spaces in the long form with a dot (.) or question mark (?) to indicate some definition is lacking. The project administrator might make guesses as to what the base long form might be. Check YFull for the latest TMRCA estimates. Check ISOGG for the latest long forms.
Surnames did not start coming into common use until roughly 1000 C.E. Call that the Surname Commencement Date, or SCD. Their usage began proliferating in the first half of the second millennium. When looking at two testers with the same surname who appear in different subclades of a parent haplogroup, people should take into account the usage of the surname. How common is it? When did it come into being? How extensive is it? Chances are the name falls into multiple parent haplogroups. It may be polygenetic (having different sources.) Can you compare the time when your surname was adopted with the TMRCA of your haplogroup?
A red L in a calendar entry signifies a LINEAGE or PEDIGREE bearing that SNP signature in the pertinent surname project. The term LINEAGE is used to mean a cluster of STR matches for whom the common ancestor is not precisely known. A PEDIGREE is a cluster of STR matches all sharing a documented known common ancestor. In the clusters in the yDNA results tables at FTDNA, sometimes PEDIGREEs might be embedded in LINEAGEs.
YFull's TMRCA estimates can only be as good as the data uploaded to YFull. Estimates are revised as YFull receives more data from Y SNP testers.
 Haplotype Tables Back to Top
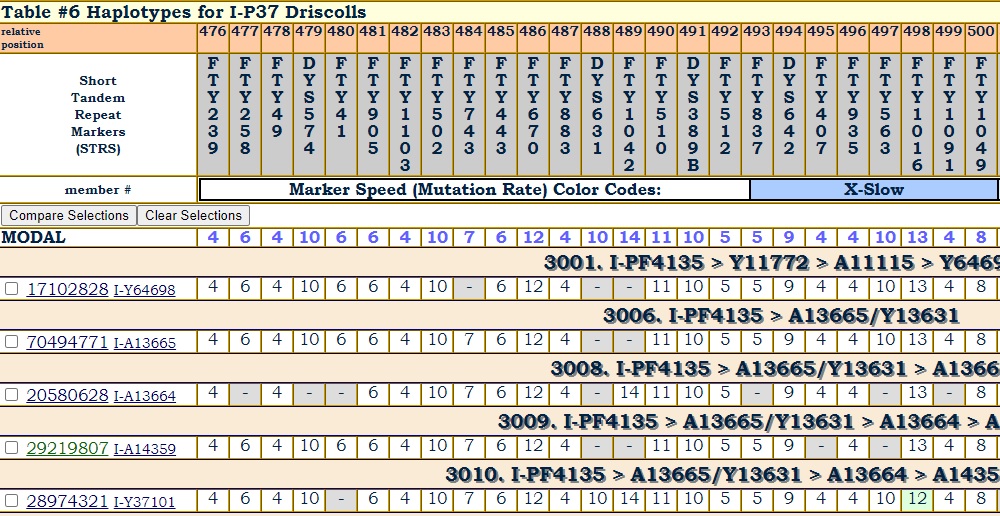
The haplotype table compares the genetic signatures, or haplotypes, of multiple testers. The "tester" might be a cluster modal, for projects with low or no participation. In projects with ACTIVE participants, the haplotypes are those of single individuals, who have been assigned a project member ID.
Depending on how much data is available to compare, 37, 67, or 111 markers could be shown.
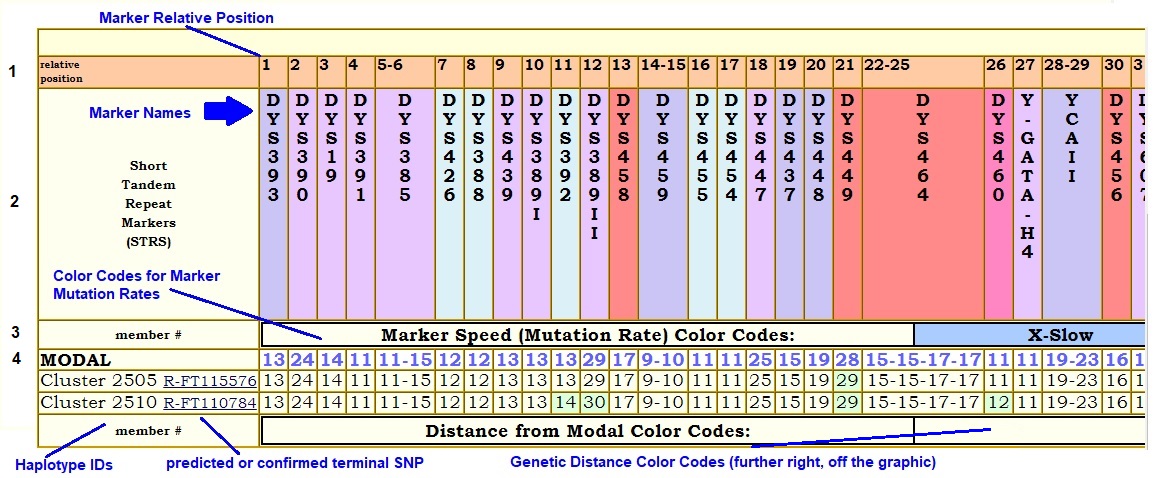
FTDNA reports STRs in a specific order. When staring at a haplotype table, it can be excruciatingly difficult to find the marker by its name. For easier marker lookup, Row 1 of the haplotype table shows Relative Positions. Any discussion on an analytics page that references an STR marker also gives its relative position.
Row 2 is Marker Names, in FTDNA order.
The first column in Row 3 is marked Member #. This column contains haplotype IDs, which could be composite modals or individual testers, depending on the circumstances. Further along Row 3 is an explanation of Mutation Rate Color Codes. Notice that the Marker Names in Row 2 bear these color codes. The color codes are assigned by relative rates; that assignment is somewhat arbitrary and opinions could differ.
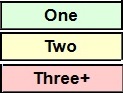 The color codes are different from what you will see on a FTDNA spreadsheet. Green is used to mark a Genetic Distance of 1 from the MODAL record. Yellow marks a Genetic Distance of 2. Pink marks a Genetic Distance greater than or equal to 3.
Row 4 contains a Modal Haplotype with which to compare the following haplotypes. If the table represents a specific cluster in the project, the modal might be derived from a project cluster modal. If multiple clusters are analyzed under the umbrella of a higher common parent haplogroup, then the modal could be derived from a higher level source. In some cases, where the parent haplogroup is well-known and recognizable, and certain STR markers are good predictors of that haplogroup, the modal might simply be borrowed from a better source such as DGM Web.
Row 5 is the first haplotype row. There is at least one such row in a table. The tester ID (Member #) might click through to a pedigree. The tester's predicted or terminal SNP appears adjacent to the ID. It will click through to that SNP on the FTDNA Haplotree.
At the bottom of the table is an explanation of Genetic Distance Color Codes. Notice that individual cells in the haplotype rows might have a color background. That is to highlight a difference from the modal row.
As of 2025, the haplogroup pages are maintaining an older Genetic Distance color scheme that deviates from what FTDNA now uses.
Haplotype tables in projects with lots of ACTIVE participation and advanced testing hold additional features.
Additional Features in tables with lots of participating members
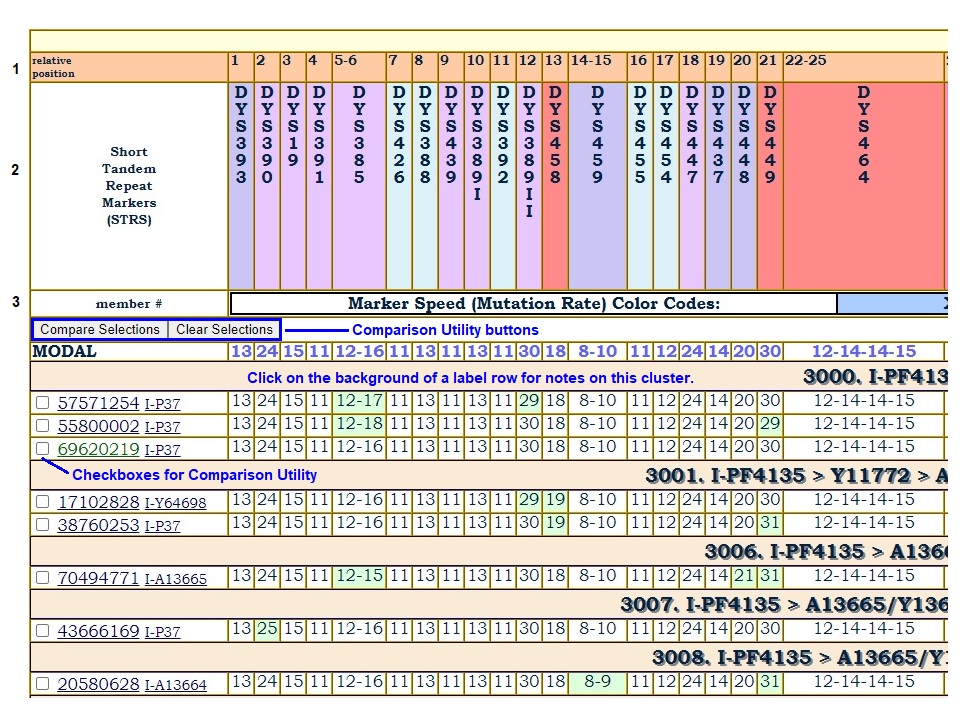
In projects with multiple project clusters represented in the same haplotype table, the clusters are separated by rows with description labels of the clusters. Clicking on a cluster label row will pop up Cluster Notes. These notes may make observations about the mutations observed in that cluster.
Cluster Notes are also made available on a separate page.
One project has nearly three dozen ACTIVE participants in a particular haplogroup. For that project, a Comparison Utility has been enabled, giving page visitors a chance to juxtapose any haplotype records next to each other in a separate popup window.
Notice that Row 4 has been replaced by control buttons for the Comparison Utility. The Modal is now pushed down to Row 5.
Additional Features in tables with lots of Big Y testers
The standard Y STR test at FTDNA covers as many as 111 markers. In addition to the 200,000+ SNPs it examines, FTDNA's Big Y tests hundreds of additional STR markers.
The conventional wisdom is that there is little additional information on the extra markers. But if there isn't any additional information, then why test them?
One project has observed some interesting correlations between mutations on extra markers with mutations on the first 111 markers. That project splits up those remaining markers on extra haplotype tables so that participating members can see those extra markers and compare them.
 Genetic Distance Back to Top
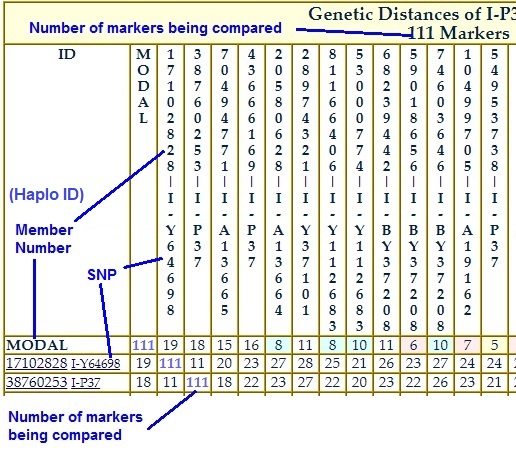
The Genetic Distance Table has a Color Key, based on FTDNA's Measures of Relatedness. The measures may or may not perfectly reflect the reality of relationships in your particular lineage and haplogroup.
The Number of Markers Being Compared is shown in the table title and is also in the diagonal. |
 |
||||||
| Genetic Distance is the number of differences found between the markers of two testers. FTDNA uses a hybrid model consisting of an infinite alleles treatment on multicopy markers and a stepwise treatment on normal markers. An article from 2016 explains how FTDNA calculates Genetic Distance. | |||||||
| Genetic Distance is simply one measure of difference between two members. It does not take into consideration the mutation rates of those markers. (See TMRCA below.) Your lowest GD match does not necessarily mean your closest relative. However, it is a good place to start in terms of comparing your marker data and family histories, then systematically working your way up the Genetic Distances. | |||||||
| The diagonal in the Genetic Distance table shows the number of markers being compared. | |||||||
| The Genetic Distance table is published on the same page as for Haplotype table 1 IF it is published. | |||||||
| How to use: Use Control-F or the Search function on your computer to find your Project Member Number in the GD table's ID column on the left. Look across your row. When you see someone with whom you want to compare, look up that column to get that member number. Then look at Haplotype Table 1 to spot the markers on which you differ. Also look for possible shared mutations. | |||||||
| The project treats multi-copy marker distances somewhat differently so the GD calculation is experimental. See: "What is a palindromic multi-copy marker?" in Part III of the DNA testing tutorial for background information. Occasionally a tester exhibits extra copies on a multi-copy marker, though deletions are possible. This occurrence may make the tester look further apart from matches than he really is. Chances are, the tester may have an abnormal number of values on more than one multi-copy marker living on the same hairpin structure on the Y chromosome. Suppose there are three multi-copy markers showing extra copies. For the time being, the project will assume they are occurring on the same single hairpin structure. The occurrence of extra values on those three multi-copy markers is thus counted as one mutation event (a hairpin structure repair event), rather than three separate mutations. The GD calculator will therefore adjust the total genetic distance of those testers from their matches downwards. | |||||||
| The project does not currently calculate Genetic Distance on more than 111 markers. | |||||||
 Time to Most Recent Common Ancestor (TMRCA) Back to Top
|
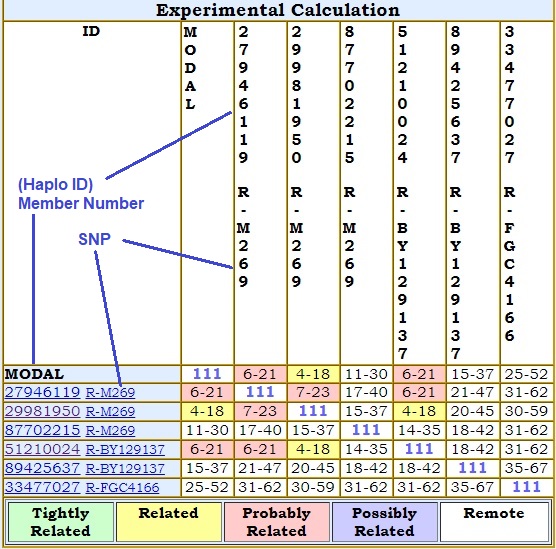 The most recent calculated generation and the most remote calculated generation are separated by a dash, e.g., 6-15. Number of generations back are calculated with a 5% to 95% confidence range. Caution must be taken interpreting results as the number of generations increases. Consistency of mutation rates on STRs may start to deteriorate after long periods of time, say, several hundred years. Time estimates become increasingly unreliable the further back we go. The TMRCA table is published on the same page as Haplotype table 1 IF it is published. The diagonal in the table shows the number of markers being compared. Prior to 2021, TMRCA had been calculated using McGee Utilities. In 2021, new source code derived from McGee source has been developed to do the same calculations. The mathematical calculations (PosteriorDensity, Factorial, generational ranges within a 5% to 95% confidence interval, Most Likely Estimate, etc.) have been compared and debugged and give identical results to that of the McGee source. However, what gets displayed in the final TMRCA tables are another matter. The genetic distances generated by McGee source appear consistent with what is getting generated by newer project-owned source code and the resulting Genetic Distance tables appear to match. (The new source has some differences in handling extra copies on multi-copy markers; see Genetic Distance, above. Otherwise, GD values are identical.) However, the McGee source exhibits inconsistencies during the reading of stored GD values while generating its TMRCA table. This is difficult to troubleshoot. Therefore, consider the new TMRCA table derivation EXPERIMENTAL. The newer code owned by the project remains a work in progress. |
 Phylotrees, Maps, Diagrams Back to Top
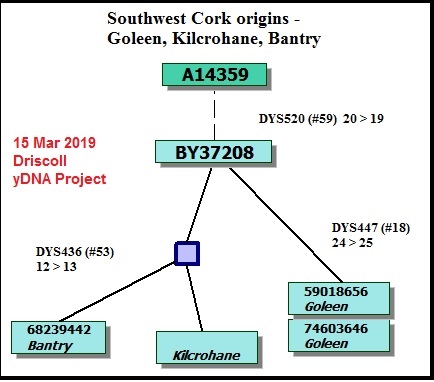
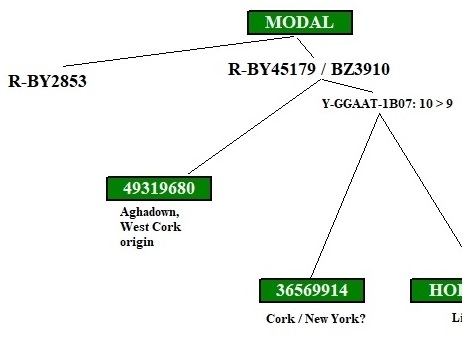
These diagrams can range from simple stick diagrams to more complex drawings. In these projects, the diagrams are hand-drawn.
Depending on how much information is available, the diagrams might show how STR markers mutate; the evolution of an SNP stream, or both. The end points are typically tagged with the haplotype IDs (project member numbers) of those participating. The geographic origins of earliest known paternal ancestors also might be noted.
Line lengths on these diagrams should generally not be construed as proportional to lengths of time.
Toolbars
Toolbars, vertical or horizontal, might appear on a haplogroup page for easier access to the entire analysis. The following icons will appear, if applicable.
 Haplogroup Page Help Guide (this page) Haplogroup Page Help Guide (this page) |
| SNP Calendar / Timeline |
| Haplotype table page; possibly as many as 6, eventually expanded to 9 with Big Y 700 |
| Genetic Distance Table on the main haplogroup page (page 1) with haplotype table 1 |
| Time to Most Recent Common Ancestor (TMRCA) Table on the main haplogroup page (page 1) with haplotype table 1 |
| Phylogenetic trees, diagrams, maps, graphics in general that illustrate mutations over time on the main haplogroup page (page 1) with haplotype table 1 |
 Mutation Rates currently used in TMRCA calculations Mutation Rates currently used in TMRCA calculations |
 DNA Testing Q&A DNA Testing Q&A |
 Navigate to Parent SNP Page Navigate to Parent SNP Page |
| IF there is sufficient data, the following might also appear.. |
 No-Reads numbers are calculated and shown on haplogroup page 2 with haplotype table 2 No-Reads numbers are calculated and shown on haplogroup page 2 with haplotype table 2 |
 Dedicated page for notes on the haplotype tables Dedicated page for notes on the haplotype tables |
 Overview and origins of the haplogroup Overview and origins of the haplogroup |